Quantum dots are an intriguing material for applications in solar cells, in video displays, as hydrolysis photocatalysts, in white LED lighting, in photoluminescent labeling for bioimaging, and for cancer treatment. Nanoparticle Zn2xCu1-xIn1-xS2 is a promising and safer alternative to lead and cadmium containing quantum dots. In this experiment you will prepare Zn0.44Cu0.78In0.78S2 quantum dots and investigate how the color, visible absorption band edge, and photoluminescence wavelength peak depend on the size of the particle. Octadecene is used as a non-coordinating solvent with a high boiling point. Oleic acid and stearic acid are used as ligands to dissolve the metal salts in the solvent at about 150 °C. Dodecanethiolate coordinates to the metal ion and above 200 °C the metal thiolate decomposes to produce metal sulfide nanoparticles, coated in the dodecanethiolate. Samples are withdrawn from the hot solution and quenched at room temperature to produce a series of increasing nanoparticle sizes with the same chemical composition.
Chemical reactions (top) that produce thiolated metal sulfide nanoparticles (bottom).
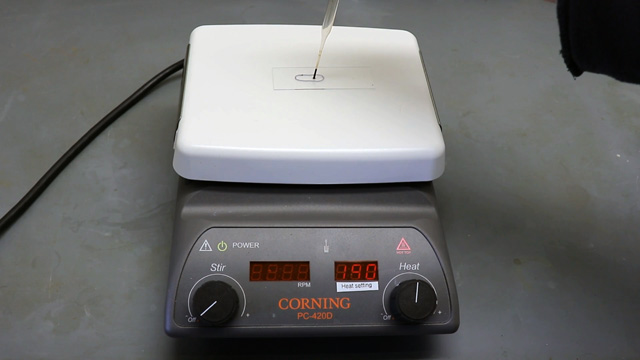
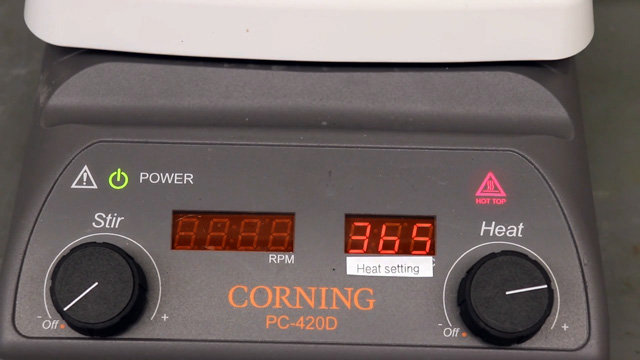
Because of the potential fire hazard, do the synthesis in a hood. Preheat a stirring hotplate to a surface temperature of 280°C (approximate Corning heat setting of 365) which will produce a solution temperature around 210 °C when the flask is in the middle of the hotplate. How long did you preheat?
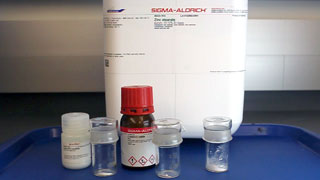
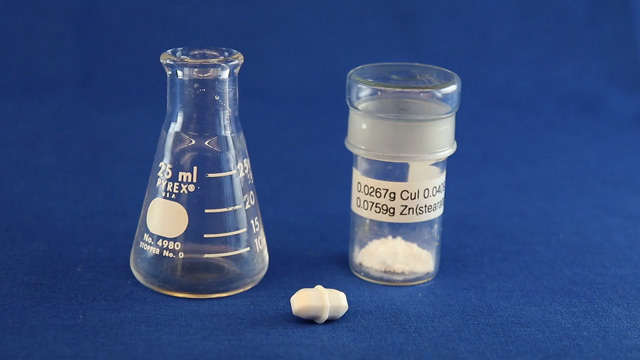
Weigh out 0.0267 g CuI (0.14 mmol), 0.0409 g In(CH3COO)3 (0.14 mmol), and 0.0759 g Zn(CH3(CH2)16COO)2 (0.12 mmol).
Avoid plastic containers to reduce static problems. This step may have been done for you with all three solids combined in one container.
Transfer the weighed sample(s) to a 25 mL Erlenmeyer flask. Add a 1/4" stir bar.
Wear gloves to add 1 mL dodecanethiol, CH3(CH2)11SH (4.2 mmol),
16 mL octadecene, CH3(CH2)15CH=CH2,
and 0.23 ml oleic acid, cis-CH3(CH2)7CH=CH(CH2)7COOH (0.72 mmol), to the Erlenmeyer flask.
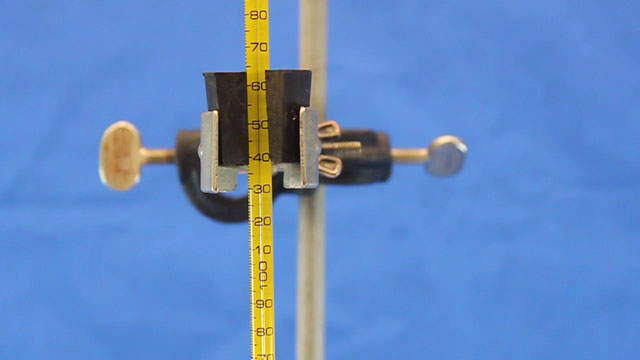
Obtain a thermometer capable of measuring 250°C and clamp it to a ring stand.
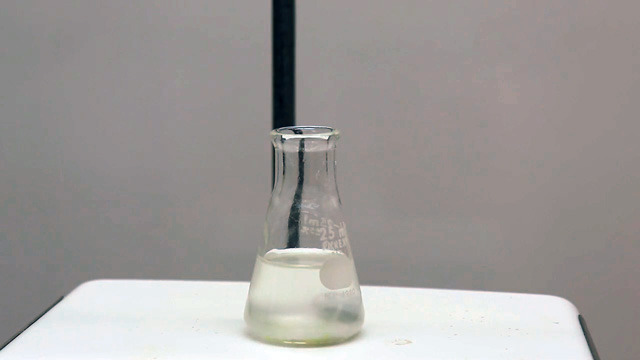
Place the flask in the center of the preheated hotplate, start timing, lower the thermometer into position, and begin stirring.
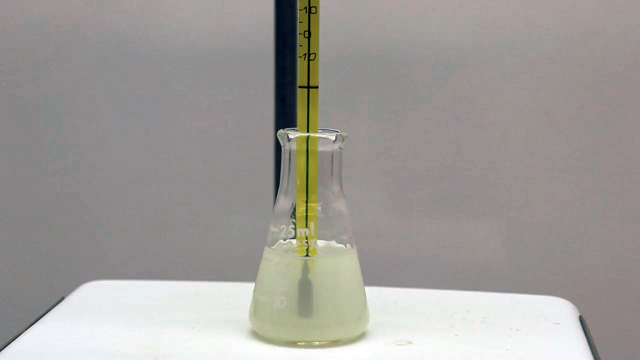
Stir for 20 minutes to dissolve the solids and decompose the dodecanethiol. The temperature should approach 210 °C. The video shows a segment every two minutes.
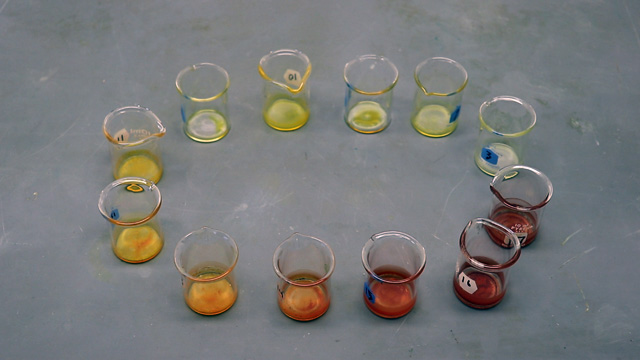
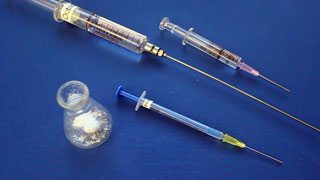
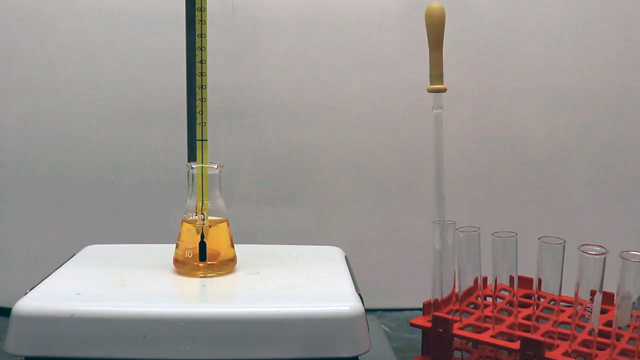
After 20 minutes of heating and the temperature has reached at least 200°C, every 90 seconds use a 9 inch glass pipet with a 2 mL bulb to transfer approximately 1-2 mL samples and quench in individual dry containers. A rack of test tubes is convenient. Fully squeeze the bulb before inserting the pipet into the solution then release to withdraw solution over a short time period. Have a partner record the total heating time and the temperature for each withdrawal. WARNING: the solution and glass will be hot so hold the bulb not the pipet! The video shows a segment every 90 seconds.
When the color begins to change noticeably between samples, decrease the sampling interval to every 60 seconds.
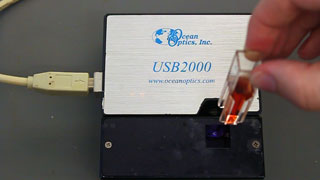
Record the visible absorbance spectra of the solutions using octadecene as a blank and a small volume (1 mL with 1 cm path length) PMMA sample cell. (You may wish to load the cuvet, measure the visible absorbance spectrum and then measure the emission wavelength in the next step before returning the sample to its original container.) You will eventually graph the band edge wavelength (see the calculation method shown below) as a function of growth time.
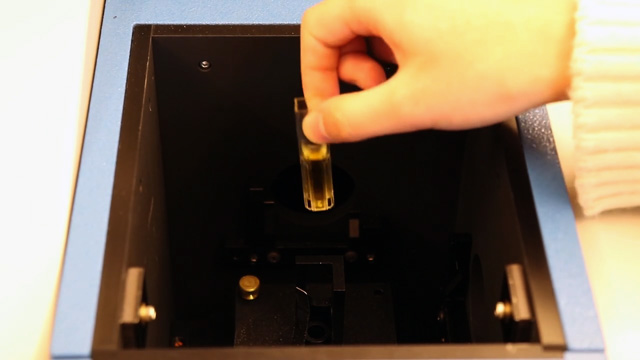
Use a 420 nm excitation and record the emission spectrum from 500-800 nm using a small volume (1 mL with 1 cm path length) PMMA sample cell and 5 nm slit width. Excite in the thin direction and observe the full path length.
If these conditions have been set on the Horiba spectrometer, for each sample click on the triangle in the upper left to run, double click on the collected spectrum to open an analysis window, click on the cursor tool, then click on the peak. The displayed x-value is the peak wavelength.
You will eventually graph the emission wavelength as a function of growth time.
Results Table
Hotplate setting:
Absorption spectra
Calculations
Emission spectra
Sample
Reaction time, minutes
Temperature
Color
Band edge wavelength, nm
Band gap energy, J
Diameter, nm
Emission wavelength, nm
1
20:00
2
21:30
3
23:00
4
5
6
7
8
9
10
11
12
13
14
15
Calculations
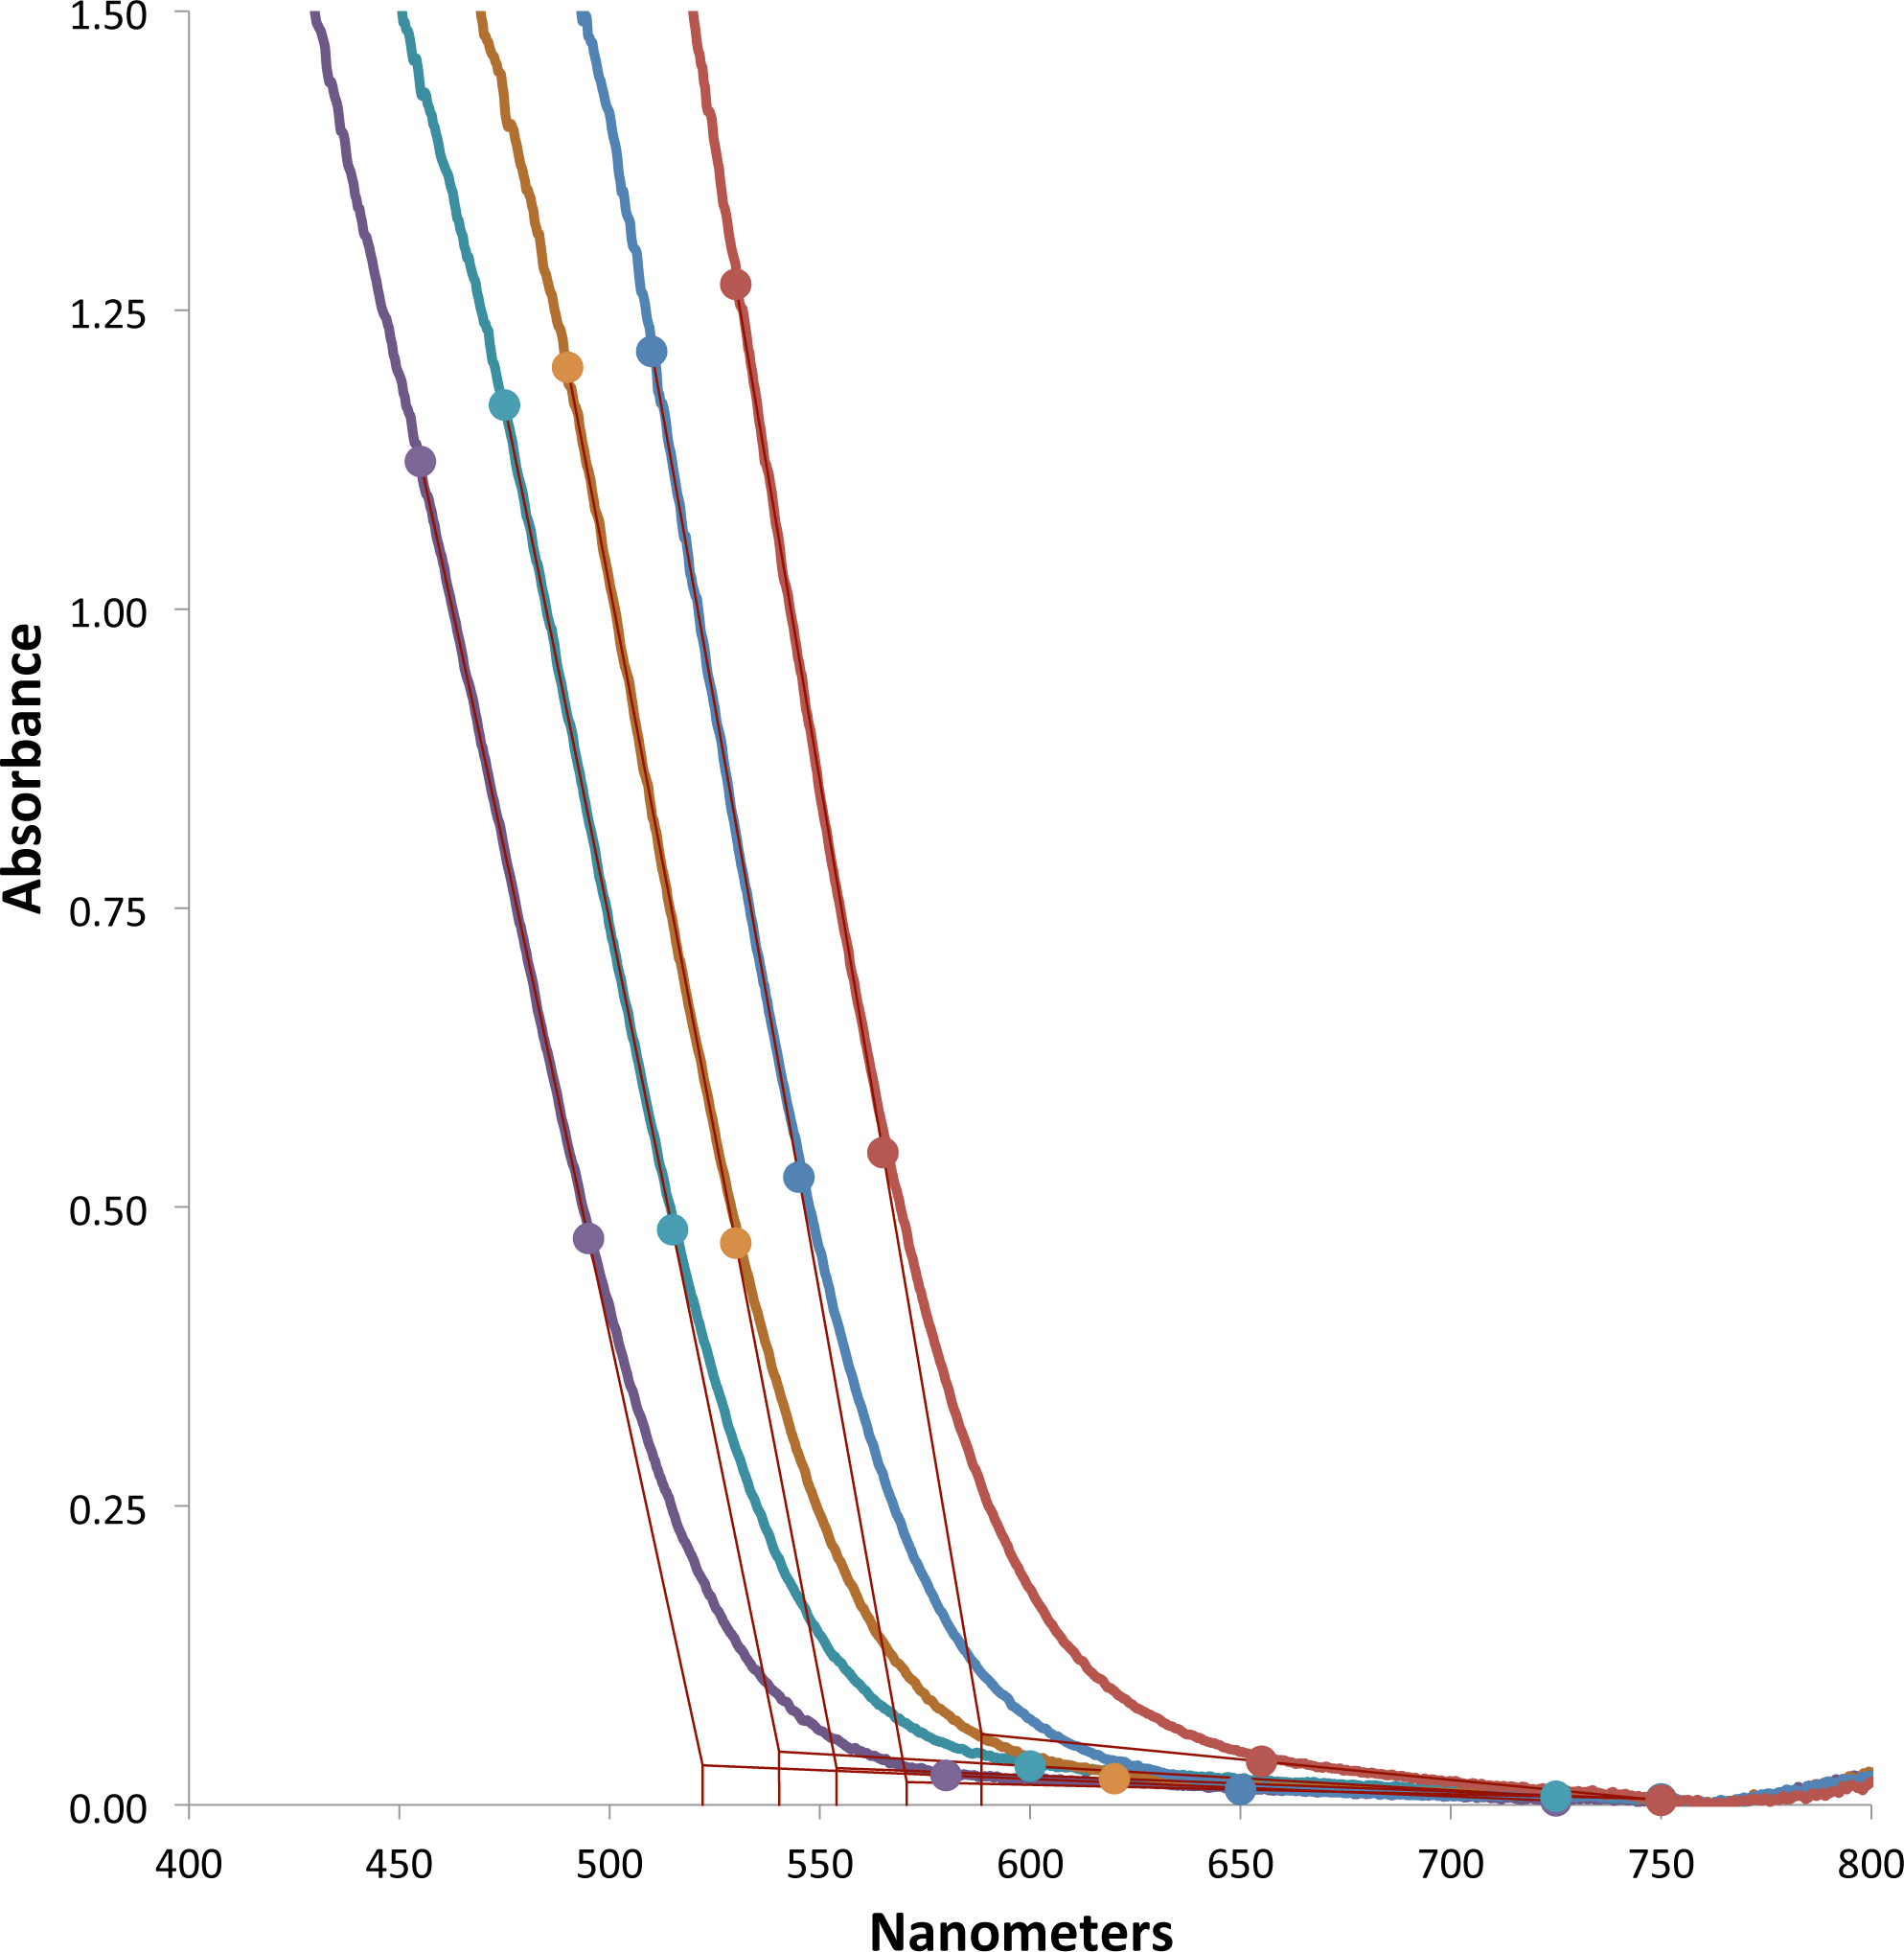
Extrapolate the linear portions of the lowest energy absorbance as a function of wavelength to find the band edge wavelength for your sample.
(One option is to use the band edge Excel template with the absorption data. Change the wavelength values in the colored shaded boxes to choose the ends of the linear portions of your absorbance graph. The program will least squares fit the interval and show the intersection of the two lines in the table.)
Finding the band edge for a semiconductor.
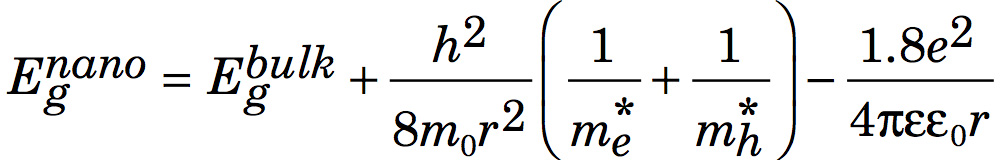
Convert the band edge wavelengths to band gap energies, Egnano and Egbulk.
Eg = h c / λ h = 6.626x10⁻³⁴ J s c = 2.998x10⁸ m/s e = 1.602x10⁻¹⁹ C
ε0 = 8.854x10⁻¹² C2/N/m2
m0 = 9.110x10⁻³¹ kg CdS
λbulk = 512 nm
ε = 5.7
me* = 0.19
mh* = 0.80
where r is the radius of the nanoparticle. The second term is the particle-in-a-box confinement energy for an electron-hole pair in a spherical quantum dot
and the third term is the Coulomb attraction between an electron and hole modified by the screening of charges by the crystal.
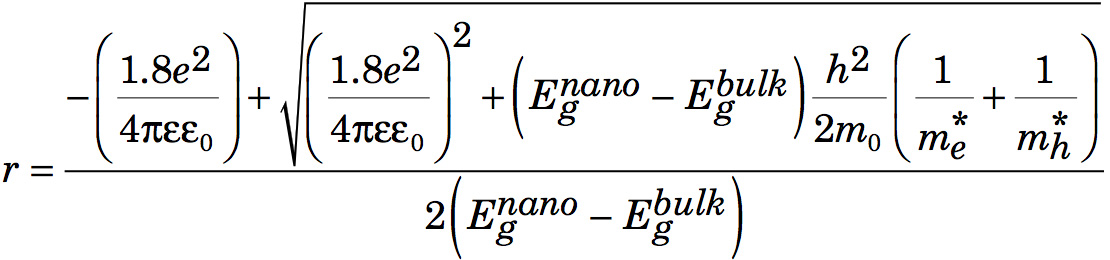
After multiplying by r2, rearranging, and using the quadratic formula to find r,
What is the band gap energy and diameter of each nanoparticle sample? Fill in your results table.
Conclusions
Use the oxidation state of each of the elements in the quantum dots to show how the overall charge is neutral.
What is your best estimate of the growth temperature for your samples? How did you decide?
Graph the absorption band edge wavelength as a function of growth time.
Graph the emission peak wavelength as a function of growth time.
How do the absorption band edge wavelengths compare with the emission peak wavelengths? Make another graph to illustrate your answer.
What is the evidence for band gap excitation rather than molecular absorbance?
Over what size range does the color, visible absorption, and photoluminescence of your samples depend on particle size?
Predict how the solubility of your quantum dots would change if you used HOCH2CH2CH2CH2CH2CH2SH instead of CH3CH2CH2CH2CH2CH2CH2CH2CH2CH2CH2CH2SH in the synthesis.
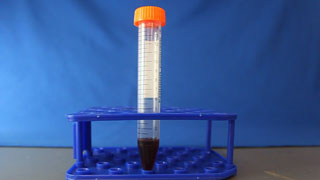
Extraction (optional extension)
To remove remove starting materials and the organic solvent, add ethanol, mix well and centrifuge at 3500 rpm. Remove the top ethanol layer and retain the colored substance at the bottom of the tube. Repeat the ethanol wash several times until only a gooey dark substance remains.
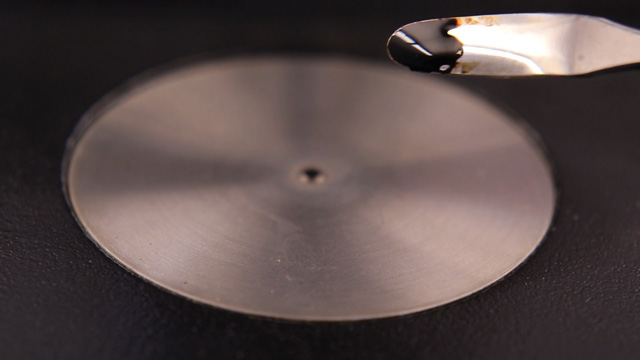
Infrared Spectroscopy (optional extension)
Do the extraction step to remove starting materials and the organic solvent. Use the backside of a spatula to transfer the sample to the ATR crystal of the infrared spectrometer.
Is the observed infrared spectrum consistent with that of dodecanethiol?
Do the extraction step to remove starting materials and the organic solvent from each timed sample. Use a small amount of heptane to transfer the extracted quantum dots to a small beaker. Evaporate the heptane. Cool. Add a small amount of concentrated nitric acid (wear gloves!) to dissolve the quantum dots. Dilute with water and transfer to a 100 mL volumetric flask. Dilute 5 mL of that solution to 25 mL using water. Measure the flame atomic absorption and compare with a series of 0.2 to 2.5ppm Zn(CH3COO)2.2H2O and CuSO4.5H2O standards. Do all the samples have the same Zn/Cu ratio?
XRD (optional extension)
Do the extraction step to remove starting materials and the organic solvent from a full batch that was all quenched at one time. Use a small amount of heptane to transfer the extracted quantum dots to the appropriate area of a glass slide on a hotplate. (Use a marker on the back side of the slide to designate the area.) Evaporate the heptane and repeat many times. Run the powder x-ray from 2θ = 25 to 60° in 0.02° steps.
Is the observed diffraction pattern intermediate between that of ZnS and CuInS2?
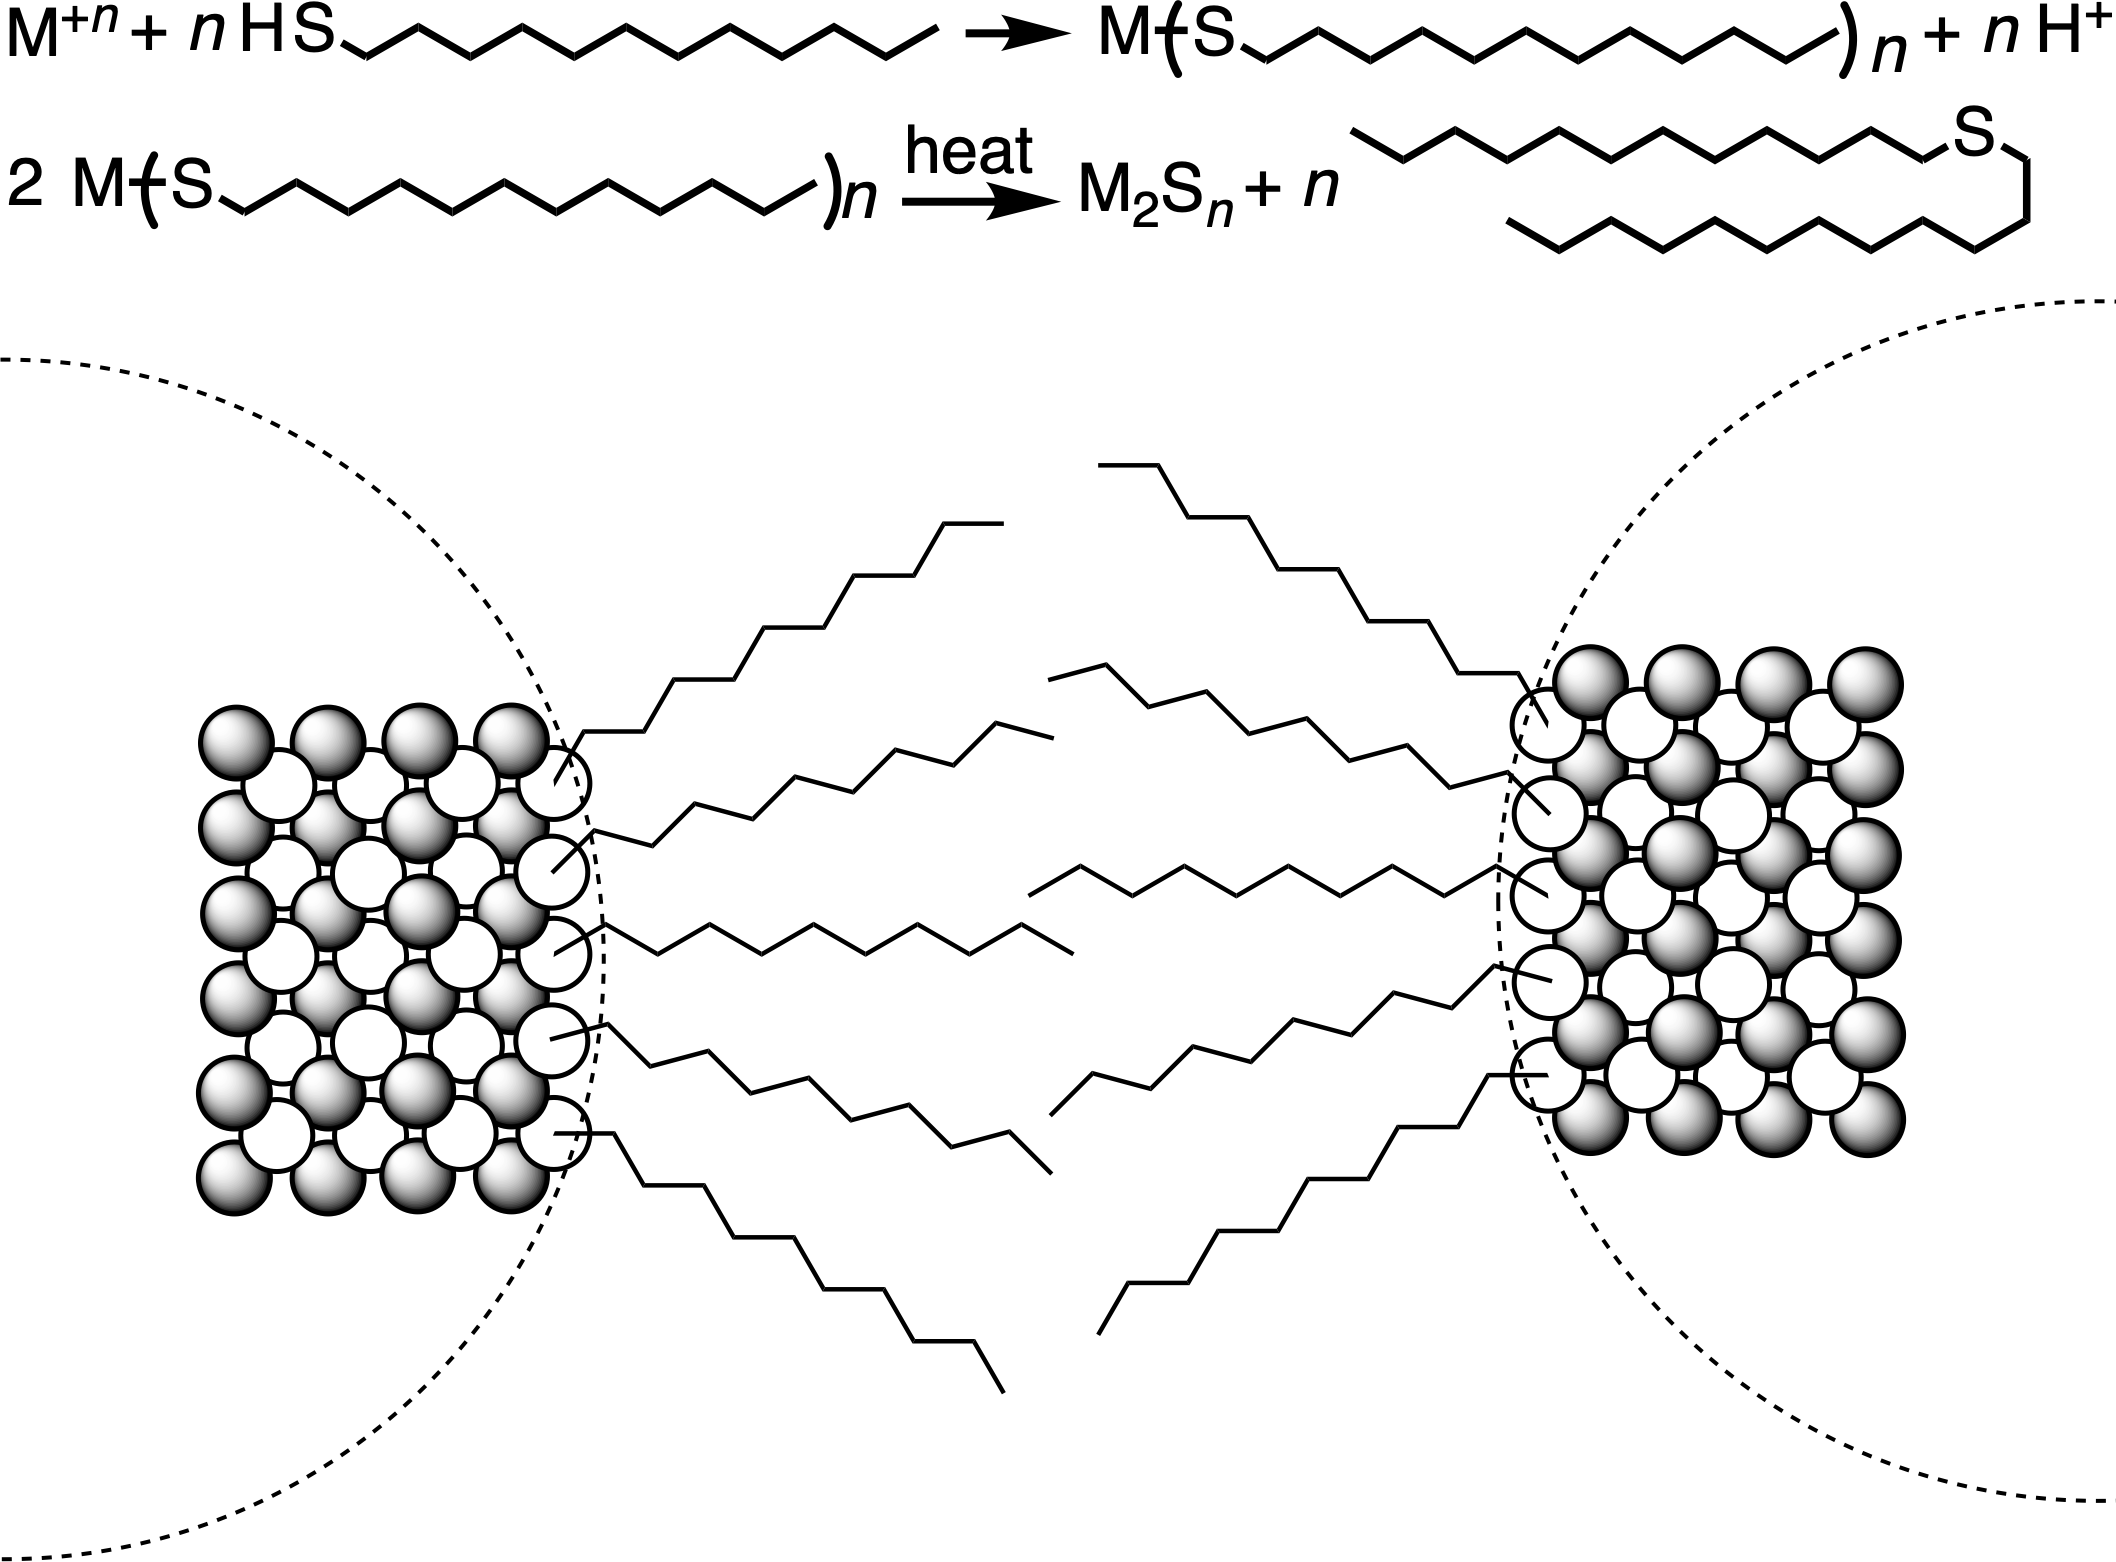 Chemical reactions (top) that produce thiolated metal sulfide nanoparticles (bottom).
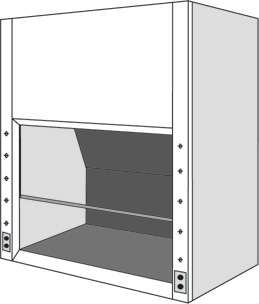
 Finding the band edge for a semiconductor.