Synthesis of Cadmium Selenide Quantum Dot Nanoparticles
Procedure is based on E. M. Boatman, G. C. Lisensky, and K. J. Nordell, "A Safer, Easier, Faster Synthesis for CdSe Quantum Dot Nanocrystals," J. Chem. Educ., 82, 1697-1699 (2005) and W. William Yu and Xiaogang Peng, "Formation of High Quality Semiconductor Nanocrystals in Non-Coordinating Solvents," Angew. Chem. Int. Ed. 41, 2368-2370 (2002).
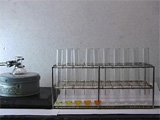
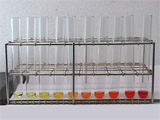
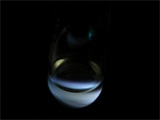
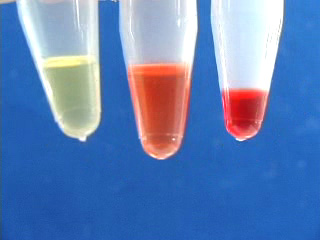
The visible absorption and photoluminescence of CdSe nanoparticles depend on the size of the particle. Octadecene is used as a non-coordinating, high-boiling solvent. A sudden injection of room temperature selenium solution into the hot cadmium solution produces seed crystals which then grow quickly. Samples are withdrawn from the hot solution and quenched at room temperature to produce a series of increasing particle sizes.
| Procedure | Wear eye protection |
Chemical gloves recommended |
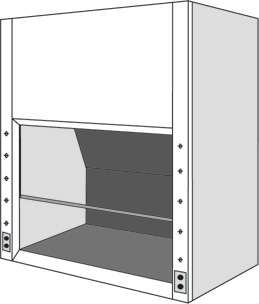 Fumehood recommended |
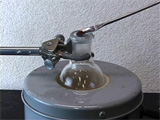
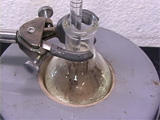
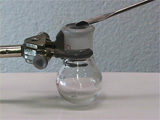
Set the flask in a heating mantle and add by pipet or syringe 0.6 mL oleic acid and 10 mL octadecene. Swirl the flask to mix the liquids. Clamp the flask in place. Obtain a thermometer capable of measuring 225 °C, clamp the thermometer at the top and insert its end in the flask.

Results Table
| Hotplate setting: | Absorption spectra | Calculations | Emission spectra | |||
| Sample | Reaction time, sec | Temperature | Band edge wavelength, nm | Band gap energy, J | Diameter, nm | Emission wavelength, nm |
| 1 | ||||||
| 2 | ||||||
| 3 | ||||||
| 4 | ||||||
| 5 | ||||||
| 6 | ||||||
| 7 | ||||||
| 8 | ||||||
| 9 | ||||||
| 10 | ||||||
Calculations
Extrapolate the linear portions of the lowest energy absorbance as a function of wavelength to find the band edge wavelength for your sample.
(One option is to use the band edge tab on the Beers Law template. Change the wavelength values in the colored shaded boxes to choose the ends of the linear portions of your absorbance graph. The program will least squares fit the interval and show the intersection of the two lines in the table. The other option is to transfer the wavelength and absorption data to the band edge spreadsheet and do the same analysis.)
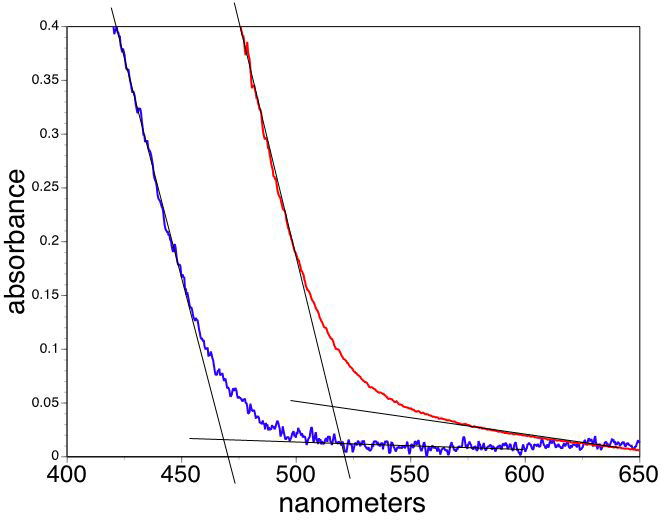 Finding the band edge for a semiconductor.
Convert the band edge wavelengths to band gap energies, Egnano and Egbulk.
Eg = h c / λ
h = 6.626x10⁻³⁴ J s
c = 2.998x10⁸ m/s
e = 1.602x10⁻¹⁹ C
ε0 = 8.854x10⁻¹² C2/N/m2
m0 = 9.110x10⁻³¹ kg
CdS
λbulk = 512 nm
ε = 5.7
me* = 0.19
mh* = 0.80
CdSe
λbulk = 709 nm
ε = 10.6
me* = 0.13
mh* = 0.45
ZnO
λbulk = 365 nm
ε = 8.66
me* = 0.24
mh* = 0.59
CuInS2
λbulk = 810 nm
ε = 11
me* = 0.16
mh* = 1.3
ZnS
λbulk = 340 nm
ε = 5.1
me* = 0.49
mh* = 0.28
PbS
λbulk = 3400 nm
ε = 17.2
me* = 0.25
mh* = 0.25
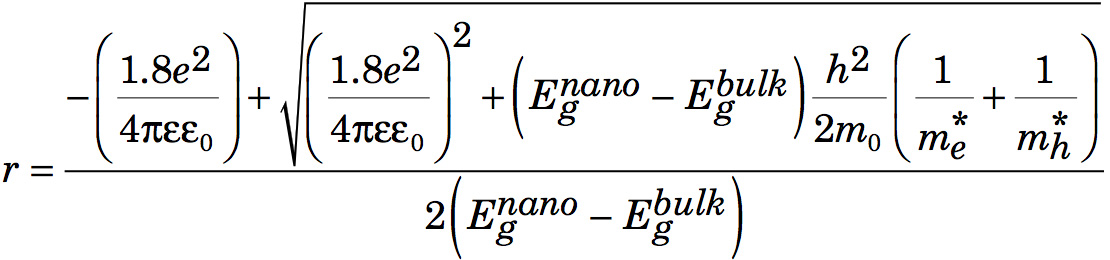
The effective mass model suggests
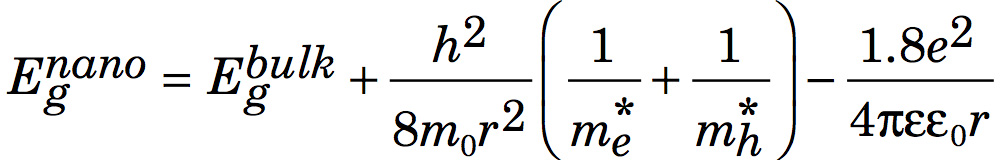
where r is the radius of the nanoparticle. The second term is the particle-in-a-box confinement energy for an electron-hole pair in a spherical quantum dot
and the third term is the Coulomb attraction between an electron and hole modified by the screening of charges by the crystal.
After multiplying by r2, rearranging, and using the quadratic formula to find r,
- Graph the band edge wavelength as a function of growth time.
- Graph the emission peak wavelength as a function of growth time.
- How do the absorption band edge wavelengths compare with the emission peak wavelengths? Make another graph to illustrate your answer.
- Add your calculation results for the band gap energy and diameter of each nanoparticle sample to your data table.
-
An alternative method of finding the nanoparticle diameter (W. William Yu, Lianhua Qu, Wenzhuo Guo, and Xiaogang Peng, Chem. Mater., 2003, 15 (14), pp 2854-2860) is based on an empirical fit of the observed wavelength of the peak, λ, for CdSe particles with known sizes measured by TEM.
diameter = 1.6122×10⁻⁹ λ4 − 2.6575×10⁻⁶ λ3 + 1.6242×10⁻³ λ2 − 0.4277 λ + 41.57
What is the diameter of the nanoparticles using this relationship? Do the TEM-peak position and the effective mass model-intercept methods give similar sizes?
- What is the evidence for band gap excitation rather than molecular absorbance?
- CdO, Aldrich 202894
- Oleic Acid, technical grade, Aldrich 364525
- Selenium, Aldrich 209651
- trioctylphosphine, technical grade, Aldrich 117854
- Octadecene, technical grade, Aldrich O806
- analytical balance (0.0001 gram) in a fume hood
- 10 mL round bottom flask and stopper
- stirrer hotplate
- 1 mL syringe with needle
- 1/4" magnetic stir bar
- 25 mL round bottom flask
- 25 mL heating mantle and controller
- 1 mL graduated pipet
- 10 mL pipet
- 250 °C thermometer
- Pasteur pipets and bulbs
- test tubes
- absorbance spectrometer and 1 mL cuvet (that does not dissolve in octadecene)
- emission spectrometer
Extraction (optional extension)
Alternative quenching (unlikely option)

CAUTION: Avoid physical contact with cadmium oxide and cadmium selenide as both are carcinogens.
Selenium stock solution
Warning: Se is an inhalation hazard and this operation should be done in a fume hood.

Chemicals

Equipment
University of Wisconsin Materials Research Science and Engineering Center
Interdisciplinary Education Group | MRSEC on Nanostructured Interfaces
This page created by George Lisensky, Beloit College. Last modified April 28, 2019 .