
![]()
Analysis of Simple NMR Spectra
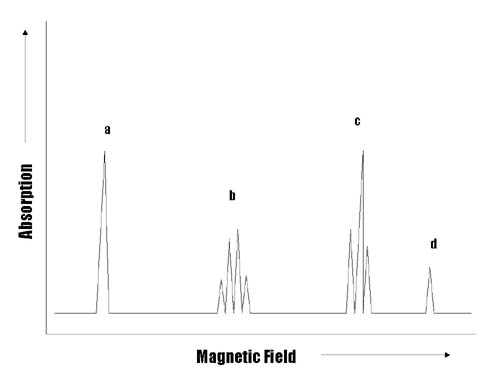
This low resolution proton NMR spectrum shows four signals, labeled a, b, c, and d. The signal labeled d is due to the internal calibration standard TMS, tetramethylsilane. This signal is assigned a chemical shift of 0 ppm.
The remaining three signals suggest that the sample has three types of protons that differ in their chemical environment. (Number of Signals = 3)
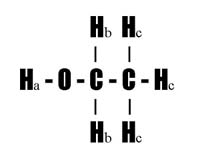
In the ethanol structure above, the Ha refers to the proton of the alcohol functional group, the Hbs refer to the methylene protons, and the Hcs refer to the methyl protons. The signal labeled a is due to the proton, Ha, attached to the O atom of the alcohol -OH functional group. The Position of this Signal varies from 3-6 ppm depending on concentration and the resulting extent of dimerization due to hydrogen bonding. This signal remains unsplit due to rapid exchange of this proton with other protons in the sample.
The signal labeled b is due to the two methylene protons, Hb. The Position of this Signal varies from 1.0-1.5 ppm in saturated molecules. It appears near the 1.5 ppm value when attached to an alcohol functional group. Signal b is split into four (4) peaks by the three adjacent methyl protons.
The signal labeled c is due to the three methyl protons, Hc. The Position of this Signal usually is observed just below 1.0 ppm in saturated molecules. Signal c is split into three (3) peaks by the two adjacent methylene protons.
For this molecule the relative Intensities of the Signals would be in a ratio of 1:2:3 based on the total area of the peaks for signals a, b, and c, respectively. This 1:2:3 ratio is due to one proton in the alcohol chemical environment, two protons in the methylene chemical environment, and three protons in the methyl chemical environment. This 1:2:3 ratio is determined by integrating the area under the peaks of signals a, b, and c, respectively.
The b signal of the methylene protons is split into four (4) peaks by the three methyl protons on the adjoining methyl carbon atom.
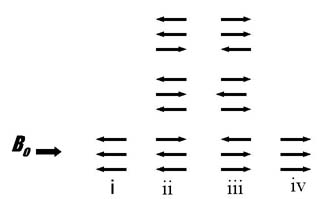
The spins of the three methyl hydrogens can align in four ways: (i) all aligned opposed to the applied field (one possibility), (ii) two opposed and one aligned with the applied field (three possibilities), (iii) one opposed and two aligned with the applied field (three possibilities), or (iv) all aligned with the applied field (one possibility). The relative areas of the resulting four peaks is approximately 1:3:3:1 based on the number of possible combinations of spin alignment.
The c signal of the methyl protons is split into three (3) peaks by the two methylene protons on the adjoining methylene carbon atom.
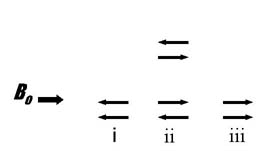
The spins of the two methylene hydrogens can align in three ways: (i) both aligned opposed to the applied field (one possibility), (ii) one opposed and one aligned with the applied field (two possibilities), (iii) both aligned with the applied field (one possibility). The relative areas of the resulting three peaks is approximately 1:2:1 based on the number of possible combinations of spin alignment.
The spacing is the same between the four peaks of the methylene signal and the three peaks of the methyl signal because the methyl protons are causing the methylene signal to split, and vice versa.
The low resolution spectrum just discussed can be interpreted using the rules governing first-order spectra. Most samples exhibit a much more complex splitting pattern that is easier to interpret using NMRs operating at higher frequencies and using advanced techniques, such as: spin decoupling, shift reagents, and various 2D experiments.
<NMR Electronic Effects] | [NMR Instruments>