These curves show the pH of an acid (analyte in flask) as a function of equvalents
of added base (titrant in buret).
|
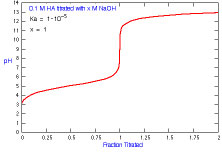
How does a titration curve change when the concentration of titrant
is changed?
|
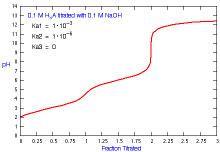
How does a titration curve change when there is more than one Ka?
|
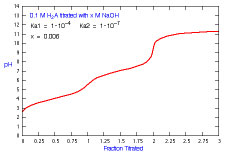
How does a titration curve change when the concentration of titrant
is changed and there is more than one Ka?
|
|
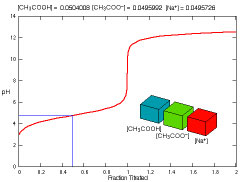
What species are present during the titration of acetic acid?
|
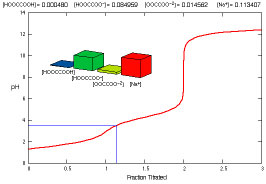
What species are present during the titration of oxalic acid?
|
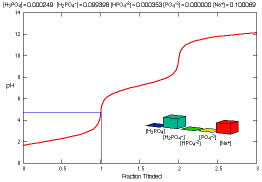
What species are present during the titration of phosphoric acid?
|
|
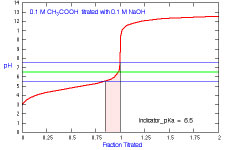
What is the appropriate indicator to use for a titration of acetic
acid?
|
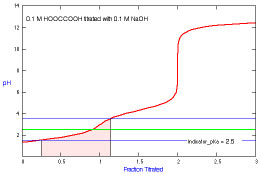
What is the appropriate indicator to use for a titration of oxalic
acid?
|
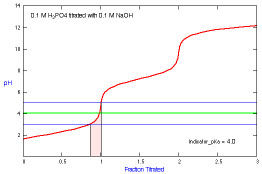
What is the appropriate indicator to use for a titration of phosphoric
acid?
|
|
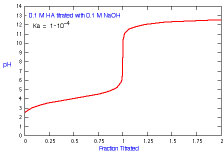
How does a titration curve change when Ka is changed?
|
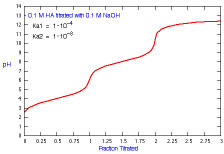
How does a titration curve change when Ka2 is changed?
|
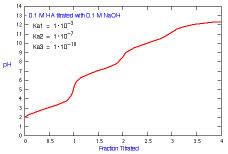
How does a titration curve change when Ka3 is changed?
|
|
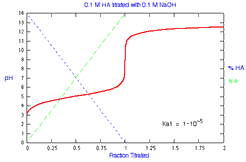
What is the distribution of species during titration of a monoprotic
acid? How does the distribution change with Ka?
|
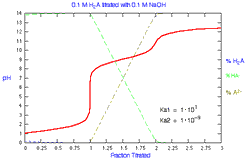
What is the distribution of species during titration of a diprotic
acid? How does the distribution change with Ka1?
|
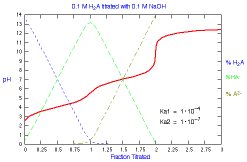
What is the distribution of species during titration of a diprotic
acid? How does the distribution change with Ka2?
|